(red curve is the normal curve)
~68% is within one standard deviation of the mean Normal Distribution
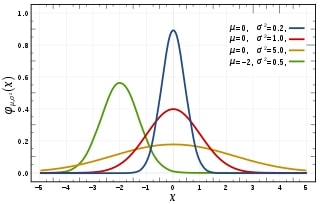
The normal curve, also known as the bell curve or the Gaussian curve, is a symmetrical and continuous probability distribution that describes the variation of many natural phenomena. The normal curve has a single peak at the mean of the data, and it falls off symmetrically on both sides.
The shape of the normal curve is determined by two parameters: the mean and the standard deviation. The mean indicates the location of the center of the curve, and the standard deviation measures the spread or variability of the data.
The normal curve has some important properties: about 68% of the data values are within one standard deviation of the mean, about 95% are within two standard deviations, and about 99.7% are within three standard deviations. The normal curve is useful for statistical analysis because many statistical tests and methods are based on the assumption that the data follows a normal distribution.
kurtosis: 3 skewness: 0 symmetrical